Analytics
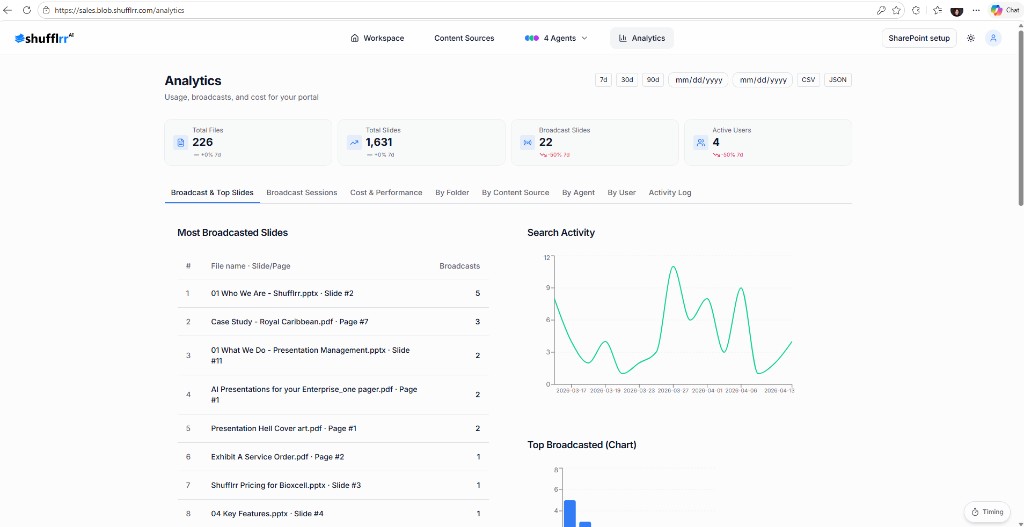
The Analytics page gives visibility into content usage, broadcasts, agents, sources, and users.
Summary cards
At the top of the page, key metrics are displayed as summary cards.
Common examples include:
- Total Files
- Total Slides
- Broadcast
- Active Users
Analytics tabs
The page includes several tabbed views.
Broadcast Session
The Broadcast Session tab shows which slides are used most often.
Costs & Performance
The Costs & Performance tab summarizes cost and performance metrics.
By Folder
The By Folder tab shows how files are distributed across folders.
By Content Source
The By Content Source tab shows how content is distributed by source type.
By Agents
The By Agents tab compares agent output and broadcasts.
By User
The By User tab lists user activity and contribution details.
Activity Log
Use the Activity Log for a detailed record of activity alongside the summary views above.
Tip: The analytics page limits the number of active agents in the selector.